Services
Document Translation
On-Site / Telephonic Interpretation
ASL Interpretation
Audio and Braille Transcription For more details
On-Site / Telephonic Interpretation
ASL Interpretation
Audio and Braille Transcription For more details
Classes
Our professional native speaking instruc- tors use the WORLDWIDE's own copy- righted courses to walk you through the beginning to advanced levels of your language using a direct approach.
What's New!
Did you ever wonder where all these languages were spoken in the US?
Check out these language maps released by the US Census!
Check out these language maps released by the US Census!
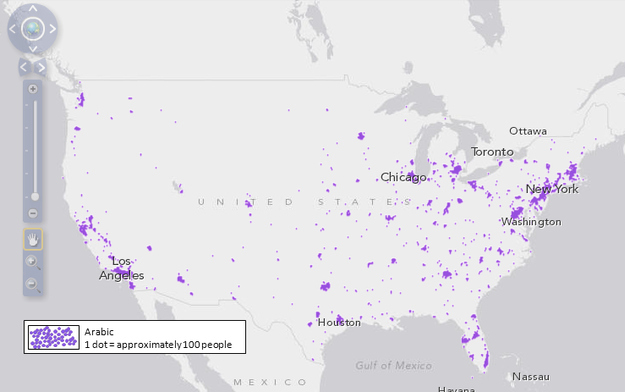
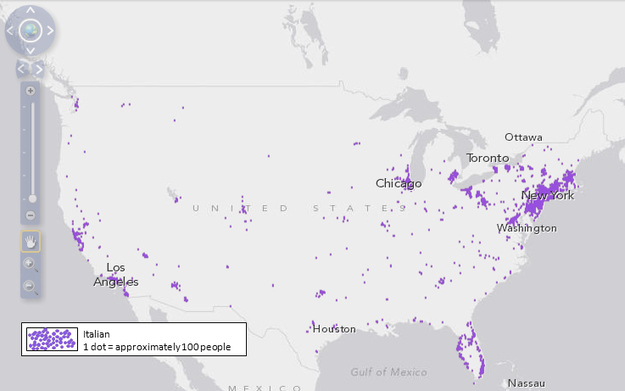
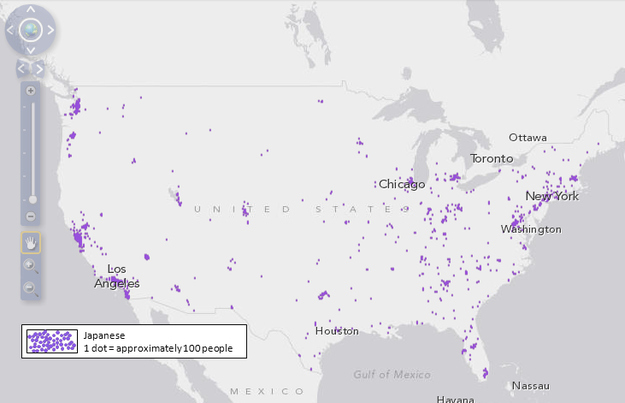
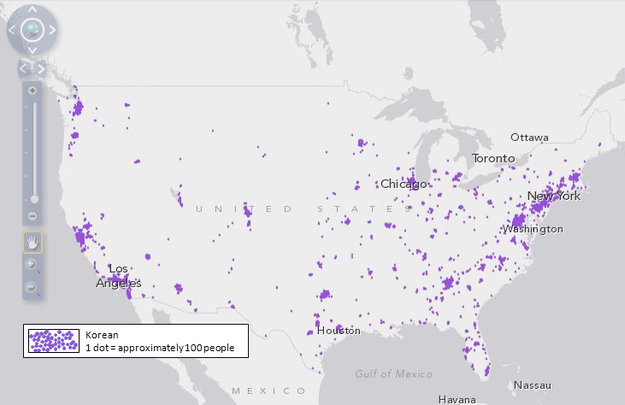
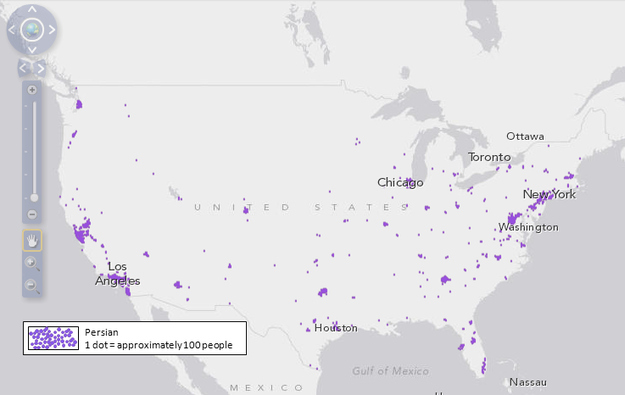
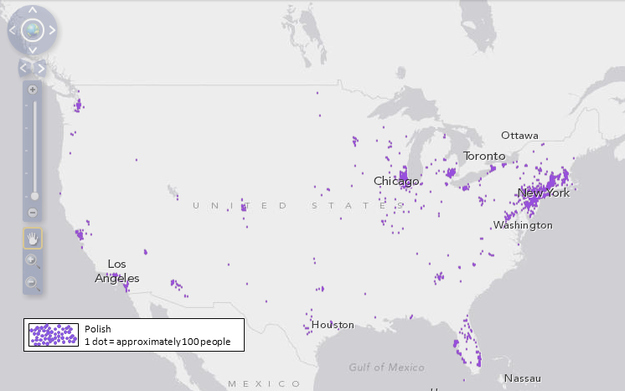
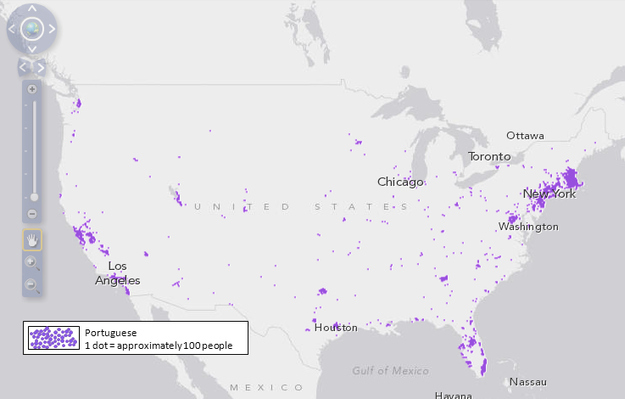
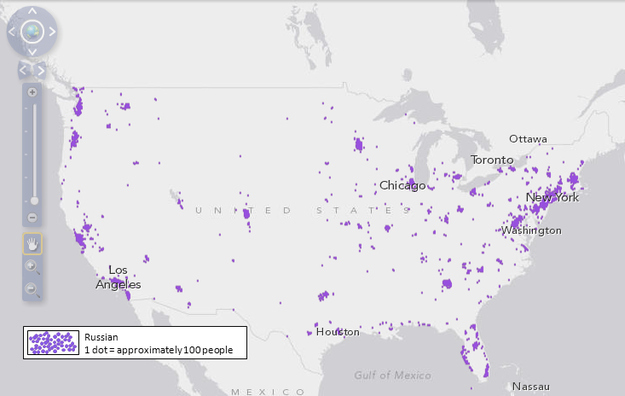
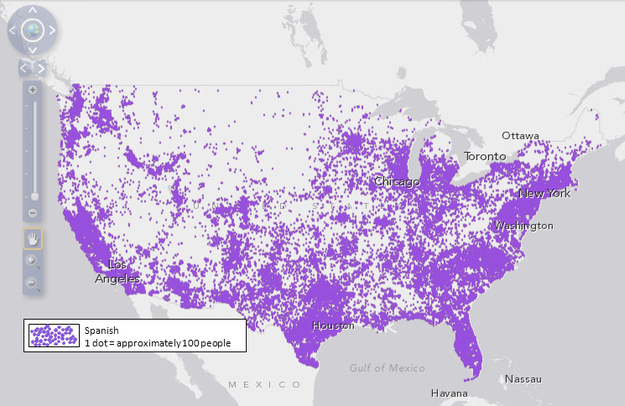
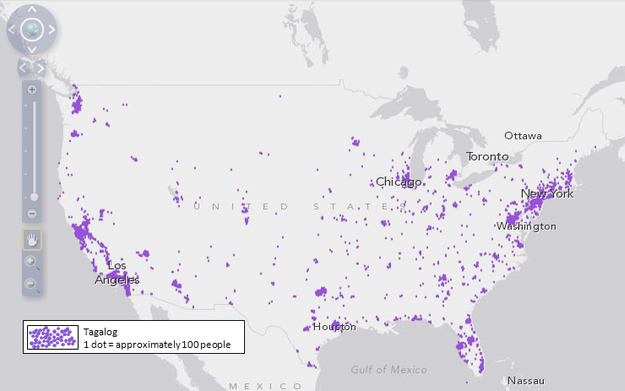
14 Maps That Show What Languages People Speak in the United States
On Tuesday, August 6th, 2013, the US Census Bureau released an interactive map that tracks where in the country there are high concentrations of non-English speaking people.
According to the data, 58% of U.S. residents age 5 and older speak English very well and also speak a language other than English at home.
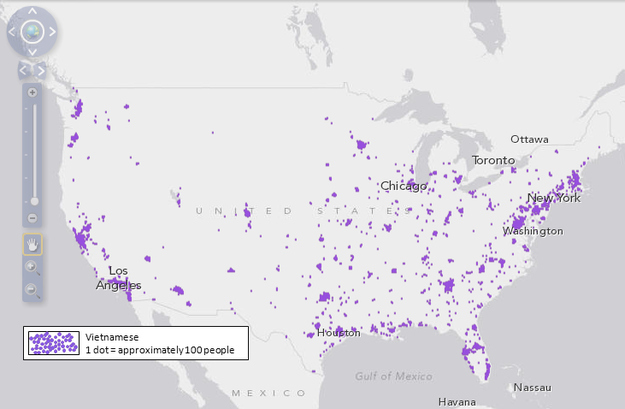
Nearly two-thirds of people who speak a language other than English at home speak Spanish (37.6 million). The third most-spoken language is Chinese (2.9 million), followed by Tagalog (1.6 million), Vietnamese (1.4 million), French (1.3 million), German (1.1 million), and Korean (1.1 million).
That state with the highest percentage of people who speak another language than English at home is California, with 44%. West Virginia has the lowest, with 2%. Laredo, Texas, is the metro area with the highest percentage, with 92%.
1) Arabic
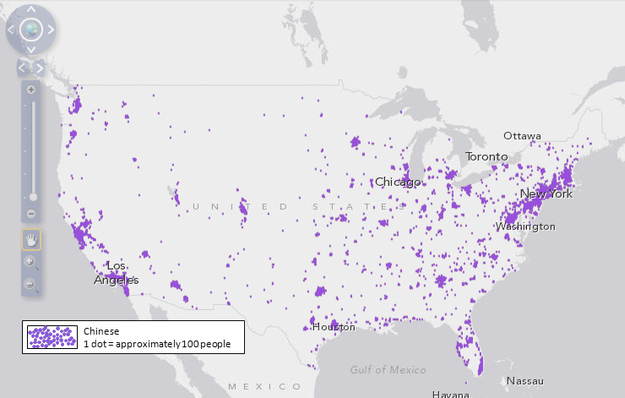
2) Chinese
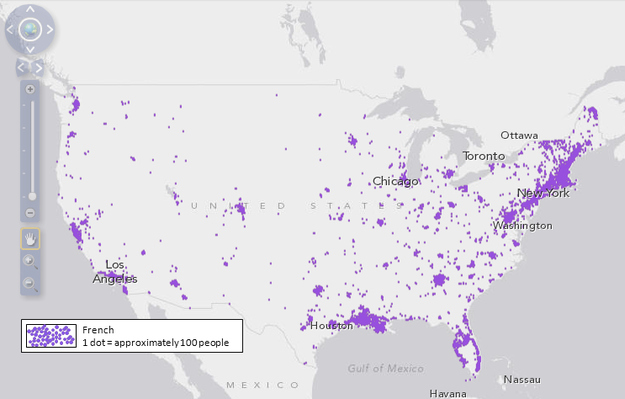
3) French
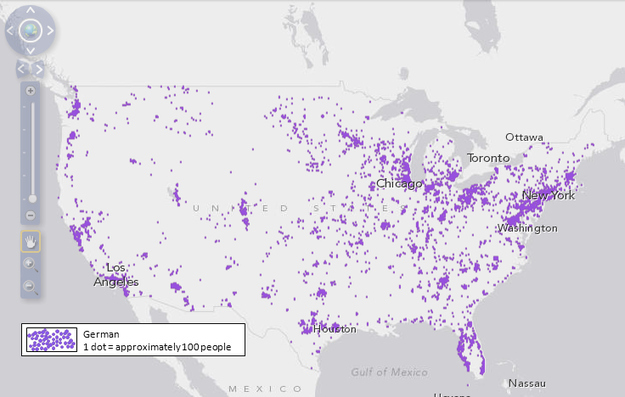
4) German
5) Italian
6) Japanese
7) Korean
8) Persian
9) Polish
10) Portuguese
11) Russian
12) Spanish
13) Tagalog
13) Vietnamese
Read more at the US Census website
Designed by Nine Tails Website Design